

Question: In this chapter, we learned about graphs that include statistical lies and graphs designed to be unclear. Think about the problems in the graph shown
In this chapter, we learned about graphs that include statistical lies and graphs designed to be unclear. Think about the problems in the graph shown here.
a. What is the primary flaw in the presentation of these data?
b. How would you redesign this graph? Be specific and cite at least three ways in which you would change it.
Description
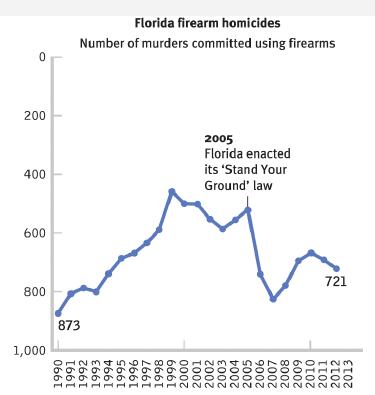
Data from the graph are summarized as follows. All data are approximate.
1990-850; 1991-800; 1992-800; 1993-750; 1994-700; 1995-
680; 1996-660; 1997-640; 1998-600; 1999-450; 2000-500;
2001-500; 2002-550; 2003-600; 2004-550; 2005-500; 2006-
750; 2007-850; 2008-800; 2009-750; 2010-750
A text pointing to data point along 2005 reads, Florida enacted its 'Stand Your Ground’ Law.
Florida firearm homicides Number of murders committed using firearms 200 2005 Florida enacted its 'Stand Your 400 Ground' law 600 721 800 873 1,000 0661 T661 1992 E661 1994 1995 9661 L661 1998 6661 0007 2002 2003 2005 9007 2007 2008 6007 2010 2012 2013
Step by Step Solution
3.48 Rating (164 Votes )
There are 3 Steps involved in it
a The primary flaw in the presentation The Yaxis is inverted Normally on a graph higher values are represented higher up on the Yaxis This graph rever... View full answer

Get step-by-step solutions from verified subject matter experts