

In analyzing hits by V-1 buzz bombs in World War II, South London was subdivided into regions,
Question:
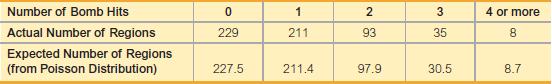
In analyzing hits by V-1 buzz bombs in World War II, South London was subdivided into regions, each with an area of 0.25 km2. Shown below is a table of actual frequencies of hits and the frequencies expected with the Poisson distribution. (The Poisson distribution is described in Section 5-3.) Use the values listed and a 0.05 significance level to test the claim that the actual frequencies fit a Poisson distribution. Does the result prove that the data conform to the Poisson distribution?
Fantastic news! We've Found the answer you've been seeking!
Step by Step Answer:

Answered By
User l_1034280
Throughout my academic journey and hands-on projects, I have accumulated a diverse range of experiences that have honed my skills as a coding, database, and Unix applications specialist. I have delved into complex coding challenges, crafting software solutions that merge functionality with efficiency. My database management expertise has been put to the test, designing and optimizing data systems that drive business intelligence and decision-making. In the realm of Unix applications, I've confidently navigated the intricate landscape of Unix-based systems, scripting automation, and ensuring robust system administration. These experiences have not only solidified my technical prowess but have also instilled in me a profound appreciation for the limitless possibilities that technology offers in solving real-world problems.
0 Reviews
10+ Question Solved
Related Book For 

Mathematical Interest Theory
ISBN: 9781470465681
3rd Edition
Authors: Leslie Jane, James Daniel, Federer Vaaler
Question Posted:
