

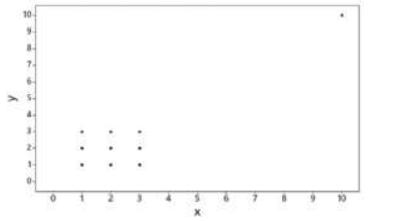
Question: Refer to the Minitab-generated scatterplot given in Exercise 11 of Section 10-1 on page 485. a. Using the pairs of values for all 10 points,
Refer to the Minitab-generated scatterplot given in Exercise 11 of Section 10-1 on page 485.
a. Using the pairs of values for all 10 points, find the equation of the regression line.
b. After removing the point with coordinates (10, 10), use the pairs of values for the remaining 9 points and find the equation of the regression line.
c. Compare the results from parts (a) and (b).
Data From Exercise 11 Section 10-1:
Refer to the accompanying Minitab-generated scatterplot.
a. Examine the pattern of all 10 points and subjectively determine whether there appears to be a correlation between x and y.
b. After identifying the 10 pairs of coordinates corresponding to the 10 points, find the value of the correlation coefficient r and determine whether there is a linear correlation.
c. Now remove the point with coordinates (10, 10) and repeat parts (a) and (b).
d. What do you conclude about the possible effect from a single pair of values?
Step by Step Solution
3.37 Rating (166 Votes )
There are 3 Steps involved in it

Get step-by-step solutions from verified subject matter experts