

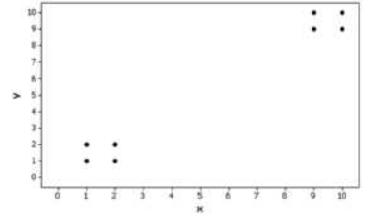
Question: Refer to the Minitab-generated scatterplot given in Exercise 12 of Section 10-1 on page 485. a. Using the pairs of values for all 8 points,
Refer to the Minitab-generated scatterplot given in Exercise 12 of Section 10-1 on page 485.
a. Using the pairs of values for all 8 points, find the equation of the regression line.
b. Using only the pairs of values for the 4 points in the lower left corner, find the equation of the regression line.
c. Using only the pairs of values for the 4 points in the upper right corner, find the equation of the regression line.
d. Compare the results from parts (a), (b), and (c).
Data From Exercise 12 Section 10-1:
Refer to the following Minitab-generated scatterplot. The four points in the lower left corner are measurements from women, and the four points in the upper right corner are from men.
a. Examine the pattern of the four points in the lower left corner (from women) only, and subjectively determine whether there appears to be a correlation between x and y for women.
b. Examine the pattern of the four points in the upper right corner (from men) only, and subjectively determine whether there appears to be a correlation between x and y for men.
c. Find the linear correlation coefficient using only the four points in the lower left corner (for women). Will the four points in the upper left corner (for men) have the same linear correlation coefficient?
d. Find the value of the linear correlation coefficient using all eight points. What does that value suggest about the relationship between x and y?
e. Based on the preceding results, what do you conclude? Should the data from women and the data from men be considered together, or do they appear to represent two different and distinct populations that should be analyzed separately?
Step by Step Solution
3.33 Rating (159 Votes )
There are 3 Steps involved in it
The tasks require us to calculate the equations for regression lines and to evaluate correlation among different subsets of data points However withou... View full answer

Get step-by-step solutions from verified subject matter experts