

The accompanying graph plots the numbers of points scored in each Super Bowl to the last Super
Question:
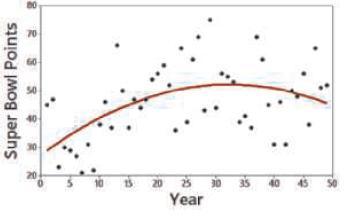
The accompanying graph plots the numbers of points scored in each Super Bowl to the last Super Bowl at the time of this writing. The graph of the quadratic equation that best fits the data is also shown in red. What feature of the graph justifies the value of R2 = 0.255 for the quadratic model?
Fantastic news! We've Found the answer you've been seeking!
Step by Step Answer:
The coefficient of determination denoted as R measures how well the quadratic model fits the data po...View the full answer

Answered By
User l_1006857
I am a computer science professional with expertise in databases, AI programming, data structures and algorithms, and mathematics. With a strong background in these areas, I possess the knowledge and skills necessary to design and optimize database systems, develop intelligent algorithms and models, and solve complex computational problems. My proficiency in SQL, NoSQL, machine learning techniques, and mathematical concepts equips me to contribute to innovative projects and drive technological advancements.
0 Reviews
10+ Question Solved
Related Book For 

Mathematical Interest Theory
ISBN: 9781470465681
3rd Edition
Authors: Leslie Jane, James Daniel, Federer Vaaler
Question Posted:
