

The table gives the number of women age 16 years or older (in millions) in the U.S.
Question:
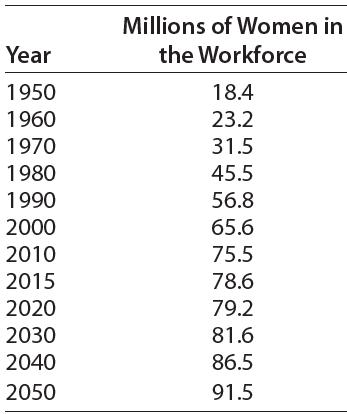
The table gives the number of women age 16 years or older (in millions) in the U.S. civilian workforce for selected years from 1950 and projected to 2050.
(a) Use x as the number of years past 1950 to create a cubic model using these data. Report the model with three significant digit coefficients.
(b) During what year does the reported model indicate that the rate of change of the number of women in the workforce reached its maximum?
(c) What feature of the graph of the function found in part (a) is the result found in part (b)?
Fantastic news! We've Found the answer you've been seeking!
Step by Step Answer:
a y 00000700x 3 000567x 2 0863x 160 b y changes from to at 2...View the full answer

Answered By
Ali Khawaja
my expertise are as follows: financial accounting : - journal entries - financial statements including balance sheet, profit & loss account, cash flow statement & statement of changes in equity -consolidated statement of financial position. -ratio analysis -depreciation methods -accounting concepts -understanding and application of all international financial reporting standards (ifrs) -international accounting standards (ias) -etc business analysis : -business strategy -strategic choices -business processes -e-business -e-marketing -project management -finance -hrm financial management : -project appraisal -capital budgeting -net present value (npv) -internal rate of return (irr) -net present value(npv) -payback period -strategic position -strategic choices -information technology -project management -finance -human resource management auditing: -internal audit -external audit -substantive procedures -analytic procedures -designing and assessment of internal controls -developing the flow charts & data flow diagrams -audit reports -engagement letter -materiality economics: -micro -macro -game theory -econometric -mathematical application in economics -empirical macroeconomics -international trade -international political economy -monetary theory and policy -public economics ,business law, and all regarding commerce
1+ Reviews
10+ Question Solved
Related Book For 

Mathematical Applications For The Management, Life And Social Sciences
ISBN: 9781337625340
12th Edition
Authors: Ronald J. Harshbarger, James J. Reynolds
Question Posted:
