

For the sample quiz scores in Problem 6, find the mean and standard deviation using the data
Question:
For the sample quiz scores in Problem 6, find the mean and standard deviation using the data
(A) Without grouping.
(B) Grouped, with class interval of width 2, starting at 9.5.
Data from Problem 6
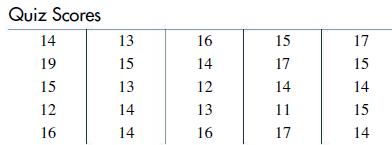
Given the sample of 25 quiz scores listed in the following table from a class of 500 students:
Construct a frequency table using a class interval of width 2, starting at 9.5.
Construct a histogram.
Construct a frequency polygon.
Construct a cumulative frequency and relative cumulative frequency table.
Construct a cumulative frequency polygon.
Fantastic news! We've Found the answer you've been seeking!
Step by Step Answer:
4 Given n25 Calculate the mean of the data as follows 141915121613151314141614121316 1517141117171...View the full answer

Answered By
Mugdha Sisodiya
My self Mugdha Sisodiya from Chhattisgarh India. I have completed my Bachelors degree in 2015 and My Master in Commerce degree in 2016. I am having expertise in Management, Cost and Finance Accounts. Further I have completed my Chartered Accountant and working as a Professional.
Since 2012 I am providing home tutions.
2+ Reviews
10+ Question Solved
Related Book For 

Finite Mathematics For Business Economics Life Sciences And Social Sciences
ISBN: 9780134862620
14th Edition
Authors: Raymond Barnett, Michael Ziegler, Karl Byleen, Christopher Stocker
Question Posted:
