

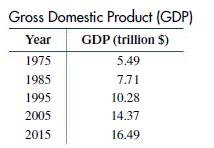
Graph the data in the following table using a bar graph. Gross Domestic Product (GDP) Year GDP
Question:
Graph the data in the following table using a bar graph.
Step by Step Answer:

This question has not been answered yet.
You can Ask your question!
Related Book For 

Finite Mathematics For Business Economics Life Sciences And Social Sciences
ISBN: 9780134862620
14th Edition
Authors: Raymond Barnett, Michael Ziegler, Karl Byleen, Christopher Stocker
Question Posted:
