In Problem, use Appendix C to find the area under the standard normal curve from 0 to
Question:
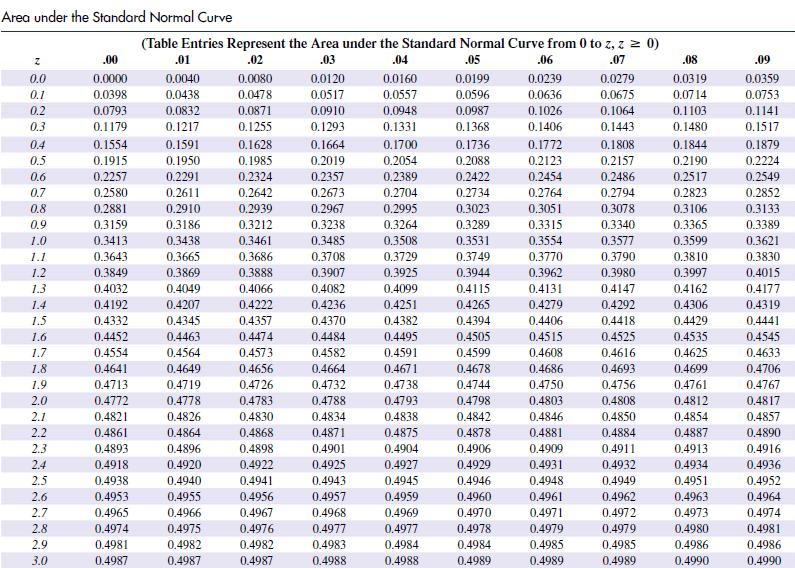
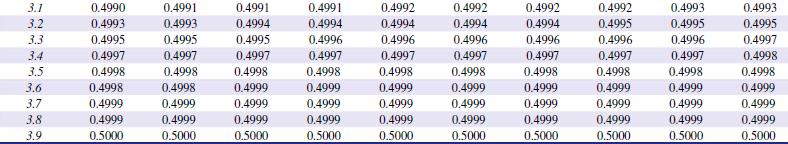
In Problem, use Appendix C to find the area under the standard normal curve from 0 to the indicated measurement.
–0.92
Data from Appendix C
Transcribed Image Text:
Area under the Standard Normal Curve Z 0.0 0.1 0.2 0.3 0.4 0.5 0.6 0.7 0.8 0.9 1.0 1.1 1.2 1.3 1.4 1.5 1.6 1.7 1.8 1.9 2.0 2.1 2.2 2.3 2.4 2.5 2.6 2.7 2.8 2.9 3.0 .00 0.0000 0.0398 0.0793 0.1179 0.1554 0.1915 0.2257 0.2580 0.2881 0.3159 0.3413 0.3643 0.3849 0.4032 0.4192 0.4332 0.4452 0.4554 0.4641 0.4713 0.4772 0.4821 0.4861 0.4893 0.4918 0.4938 0.4953 0.4965 0.4974 0.4981 0.4987 (Table Entries Represent the Area under the Standard Normal Curve from 0 to z, z = 0) .02 .03 .04 .05 .07 0.0160 0.0557 0.0948 0.1331 0.1700 0.2054 0.2389 0.2704 0.2995 0.3264 0.3508 0.3729 0.3925 .01 0.0040 0.0438 0.0832 0.1217 0.1591 0.1950 0.2291 0.2611 0.2910 0.3186 0.3438 0.3665 0.3869 0.4049 0.4207 0.4345 0.4463 0.4564 0.4649 0.4719 0.4778 0.4826 0.4864 0.4896 0.4920 0.4940 0.4955 0.4966 0.4975 0.4982 0.4987 0.0080 0.0478 0.0871 0.1255 0.1628 0.1985 0.2324 0.2642 0.2939 0.3212 0.3461 0.3686 0.3888 0.4066 0.4222 0.4357 0.4474 0.4573 0.4656 0.4726 0.4783 0.4830 0.4868 0.4898 0.4922 0.4941 0.4956 0.4967 0.4976 0.4982 0.4987 0.0120 0.0517 0.0910 0.1293 0.1664 0.2019 0.2357 0.2673 0.2967 0.3238 0.3485 0.3708 0.3907 0.4082 0.4236 0.4370 0.4484 0.4582 0.4664 0.4732 0.4788 0.4834 0.4871 0.4901 0.4925 0.4943 0.4957 0.4968 0.4977 0.4983 0.4988 0.4099 0.4251 0.4382 0.4495 0.4591 0.4671 0.4738 0.4793 0.4838 0.4875 0.4904 0.4927 0.4945 0.4959 0.4969 0.4977 0.4984 0.4988 0.0199 0.0596 0.0987 0.1368 0.1736 0.2088 0.2422 0.2734 0.3023 0.3289 0.3531 0.3749 0.3944 0.4115 0.4265 0.4394 0.4505 0.4599 0.4678 0.4744 0.4798 0.4842 0.4878 0.4906 0.4929 0.4946 0.4960 0.4970 0.4978 0.4984 0.4989 .06 0.0239 0.0636 0.1026 0.1406 0.1772 0.2123 0.2454 0.2764 0.3051 0.3315 0.3554 0.3770 0.3962 0.4131 0.4279 0.4406 0.4515 0.4608 0.4686 0.4750 0.4803 0.4846 0.4881 0.4909 0.4931 0.4948 0.4961 0.4971 0.4979 0.4985 0.4989 0.0279 0.0675 0.1064 0.1443 0.1808 0.2157 0.2486 0.2794 0.3078 0.3340 0.3577 0.3790 0.3980 0.4147 0.4292 0.4418 0.4525 0.4616 0.4693 0.4756 0.4808 0.4850 0.4884 0.4911 0.4932 0.4949 0.4962 0.4972 0.4979 0.4985 0.4989 .08 0.0319 0.0714 0.1103 0.1480 0.1844 0.2190 0.2517 0.2823 0.3106 0.3365 0.3599 0.3810 0.3997 0.4162 0.4306 0.4429 0.4535 0.4625 0.4699 0.4761 0.4812 0.4854 0.4887 0.4913 0.4934 0.4951 0.4963 0.4973 0.4980 0.4986 0.4990 .09 0.0359 0.0753 0.1141 0.1517 0.1879 0.2224 0.2549 0.2852 0.3133 0.3389 0.3621 0.3830 0.4015 0.4177 0.4319 0.4441 0.4545 0.4633 0.4706 0.4767 0.4817 0.4857 0.4890 0.4916 0.4936 0.4952 0.4964 0.4974 0.4981 0.4986 0.4990
Fantastic news! We've Found the answer you've been seeking!
Step by Step Answer:
Answer rating: 100% (6 reviews)
To find the area under the standard normal curve from 0 to 092 we will use the standard nor...View the full answer
Answered By
Caroline Kinuthia
Taking care of the smaller details in life has a larger impact in our general well being, and that is what i believe in. My name is Carol. Writing is my passion. To me, doing a task is one thing, and delivering results from the task is another thing. I am a perfectionist who always take things seriously and deliver to the best of my knowledge.
4.90+
1933+ Reviews
4269+ Question Solved
Related Book For
Finite Mathematics For Business Economics Life Sciences And Social Sciences
ISBN: 9780134862620
14th Edition
Authors: Raymond Barnett, Michael Ziegler, Karl Byleen, Christopher Stocker
Question Posted:
Students also viewed these Mathematics questions
-
In Problem use Appendix C to find the area under the standard normal curve and above the given interval on the horizontal axis. [0.6, ) Data from Appendix C Area under the Standard Normal Curve Z 0.0...
-
In Problem use Appendix C to find the area under the standard normal curve and above the given interval on the horizontal axis. [2.1, 0.9] Data from Appendix C Area under the Standard Normal Curve Z...
-
In Problem use Appendix C to find the area under the standard normal curve and above the given interval on the horizontal axis. [, 0.1] Data from Appendix C Area under the Standard Normal Curve Z 0.0...
-
Consider the heat pump described in Example 9.14. The heat pump now operates between 0.60 MPa and 1.4 MPa. Plot the vapor-compression cycle in Ts coordinates (use NIST) and determine the cycle...
-
A liquid mixture consisting of 100 kmol of 60 mol% benzene, 25 mol% toluene, and 15 mol% o-xylene is flashed at 1 atm and 100C. (a) Compute the amounts of liquid and vapor products and their...
-
The five nodes in the following network represent points one year apart over a four-year period. Each node indicates a time when a decision is made to keep or replace a firms computer equipment. If a...
-
Find the mean and the standard deviation of the distribution of each of the following random variables (having binomial distributions): (a) The number of heads in 440 flips of a balanced coin. (b)...
-
With gasoline prices increasing, drivers are more concerned with their cars gasoline consumption. For the past 5 years a driver has tracked the gas mileage of his car and found that the variance from...
-
Write a C program using the fork() system call that calculate the factorial in the child process. The number will be provided from the command line. For example, if 5 is passed as a parameter on the...
-
An oil company produces three brands of oils: Regular, Multi grade, and Supreme. Each brand of oil is composed of one or more of four crude stocks, each having a different viscosity index. The...
-
Evaluate n C x p x q n x for the values of n, x, and p given in Problem. n = 4, x = 3, p = 2/3
-
For the set of sample measurements 1, 1, 2, 2, 2, 3, 3, 4, 4, 5, find the (A) Mean (B) Median (C) Mode (D) Standard deviation
-
Why would a reprecipitation be employed in a gravimetric analysis?
-
Watch a video detailing some type of team-building function (e.g., military boot camp, exercise classes, athletics). Attempt to identify the purpose of the team-building exercise, as well as why it...
-
On January 1, 2015, Harrington Company has the following defined benefit pension plan balances. The interest (settlement) rate applicable to the plan is 10%. On January 1, 2016, the company amends...
-
Use the following Taylor rule to calculate what would happen to the real interest rate if inflation increased by three percentage points. Target federal funds rate = Natural rate of interest +...
-
Have you ever experienced information overload? If so, what are some strategies you implement to help you with time management, filtering spam and email forwards, excessive text messages, and other...
-
Figure Q2.10 shows the position graph for an object moving along the horizontal axis. Data in Figure Q2.10 a. Write a realistic motion short story for an object that would have this position graph....
-
What was the purpose of changing from the facts and circumstances depreciation method to the ACRS method?
-
Provide examples of a situations in which environmental disruptions affected consumer attitudes and buying behaviors.
-
Let denote some population proportion of interest and suppose a 95% confidence interval for is calculated to be (0.6, 0.7). Also, suppose that we want to test H 0 : = 0.63 vs. H a : 0.63 What...
-
Summarize your findings. If you were to repeat this study, would you gather your sample in a different way? Are there things about the study you would change? What further research might you follow...
-
Now, lets step back a bit and think about the scope of our inference. What are the wider implications? Do you think that your conclusion holds true for people in general? What is the broader...
-
describe the difference between a swap broker and a swap dealer. 2. what is the necessary condition for a fixed -for-floating interest rate swap to be possible? 3. discuss the risks confronting an...
-
Assume the carrying capacity of the earth is 9 billion. Use the 1960s peak annual growth rate of 2.1% and population of 3 billion to predict the base growth rate and current growth rate with a...
-
Discounted economy airfares have risen the most, but there is still strong demand for them. What does this suggest about the price elasticity of demand (PED) for these fares, the slope of the demand...
Study smarter with the SolutionInn App