

Table 4 shows the yield (in bushels per acre) and the total production (in millions of bushels)
Question:
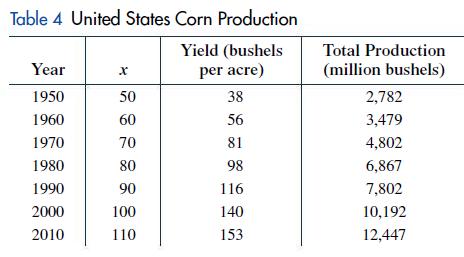
Table 4 shows the yield (in bushels per acre) and the total production (in millions of bushels) for corn in the United States for selected years since 1950. Let x represent years since 1900. Find a logarithmic regression model (y = a + b ln x) for the yield. Estimate (to the nearest bushel per acre) the yield in 2024.
Fantastic news! We've Found the answer you've been seeking!
Step by Step Answer:
To find a logarithmic regression model for the yield we will use the given data to fit the model y a ...View the full answer

Answered By
PALASH JHANWAR
I am a Chartered Accountant with AIR 45 in CA - IPCC. I am a Merit Holder ( B.Com ). The following is my educational details.
PLEASE ACCESS MY RESUME FROM THE FOLLOWING LINK: https://drive.google.com/file/d/1hYR1uch-ff6MRC_cDB07K6VqY9kQ3SFL/view?usp=sharing
3+ Reviews
10+ Question Solved
Related Book For 

Finite Mathematics For Business Economics Life Sciences And Social Sciences
ISBN: 9780134862620
14th Edition
Authors: Raymond Barnett, Michael Ziegler, Karl Byleen, Christopher Stocker
Question Posted:
