

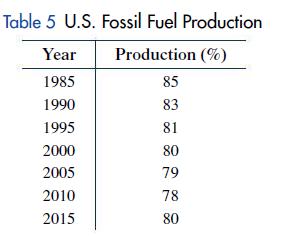
Table 5 lists U.S. fossil fuel production as a percentage of total energy production for selected years.
Question:
Table 5 lists U.S. fossil fuel production as a percentage of total energy production for selected years. A linear regression model for this data is y = –0.19x + 83.75 where x represents years since 1985 and y represents the corresponding percentage of total energy production.
(A) Draw a scatter plot of the data and a graph of the model on the same axes.
(B) Interpret the slope of the model.
(C) Use the model to predict fossil fuel production in 2025.
(D) Use the model to estimate the first year for which fossil fuel production is less than 70% of total energy production.
Step by Step Answer:

This question has not been answered yet.
You can Ask your question!
Related Book For 

Finite Mathematics For Business Economics Life Sciences And Social Sciences
ISBN: 9780134862620
14th Edition
Authors: Raymond Barnett, Michael Ziegler, Karl Byleen, Christopher Stocker
Question Posted:
