

Question: Perform a multiple regression analysis using pescore as the dependent variable and each of the six predictors identified in Exercise 8.2 as the independent variables.
Perform a multiple regression analysis using pescore as the dependent variable and each of the six predictors identified in Exercise 8.2 as the independent variables. Choose “enter” as the method.
1. What is the sample size analyzed?
2. What is the magnitude of the estimated multiple correlation coefficient (R) obtained in this analysis?
3. What is the magnitude of the estimated squared multiple correlation coefficient (R2) obtained in this analysis?
4. What is the magnitude of the standard error of estimate obtained in this analysis?
5. Write out the unstandardized regression equation.
6. Write out the standardized regression equation.
7. What predictors have significant regression weights?
Exercise 8.2
Use the data set “Bus driver.sav” to correlate the possible predictors with the job performance measures and then answer the following questions.
1. Overall, how highly are the possible predictors intercorrelated?
2. Overall, how highly are the job performance measures intercorrelated?
3. Overall, how useful would the personality measures be in predicting job performance?
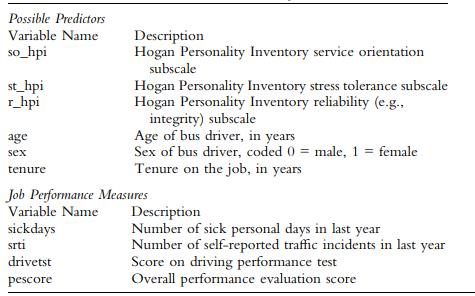
Possible Predictors Variable Name so_hpi st_hpi r_hpi age sex tenure Description Hogan Personality Inventory service orientation subscale Hogan Personality Inventory stress tolerance subscale Hogan Personality Inventory reliability (e.g., drivetst pescore integrity) subscale Age of bus driver, in years Sex of bus driver, coded 0 = male, 1 = female Tenure on the job, in years Job Performance Measures Variable Name sickdays srti Description Number of sick personal days in last year Number of self-reported traffic incidents in last year Score on driving performance test Overall performance evaluation score
Step by Step Solution
3.35 Rating (167 Votes )
There are 3 Steps involved in it
The resulting regression output is presented below 1 Since N df ... View full answer

Get step-by-step solutions from verified subject matter experts