

Question: Figure 10.46 shows the experimental transfer function of a structure. Determine the approximate values of (omega_{mathrm{i}}) and (zeta_{mathrm{i}}). Magnitude (dB) 20,000 2000 200 20 20
Figure 10.46 shows the experimental transfer function of a structure. Determine the approximate values of \(\omega_{\mathrm{i}}\) and \(\zeta_{\mathrm{i}}\).
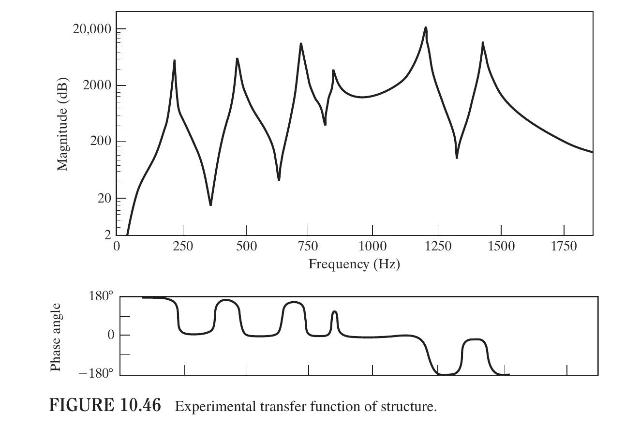
Magnitude (dB) 20,000 2000 200 20 20 180 2 0 250 500 750 1000 Frequency (Hz) 1250 1500 1750 0 -180 FIGURE 10.46 Experimental transfer function of structure.
Step by Step Solution
★★★★★
3.49 Rating (156 Votes )
There are 3 Steps involved in it
1 Expert Approved Answer
Step: 1 Unlock

Question Has Been Solved by an Expert!
Get step-by-step solutions from verified subject matter experts
Step: 2 Unlock
Step: 3 Unlock