Demonstrate graphically the net gain to producers and the net loss to consumers if suppliers are able
Question:
Demonstrate graphically the net gain to producers and the net loss to consumers if suppliers are able to restrict their output to Qr in the accompanying graph. Demonstrate the net deadweight loss to society.
Transcribed Image Text:
Price 0 Q, Q Quantity Demand Supply
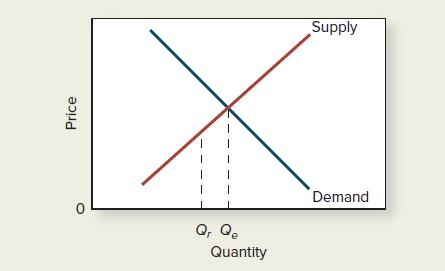
Step by Step Answer:
This question has not been answered yet.
You can Ask your question!
Related Book For
Question Posted:
Students also viewed these Business questions
-
Multiple Choice Questions 1. In a supply and demand graph, the triangular area under the demand curve but above the market price is a. The consumer surplus. b. The producer surplus. c. The marginal...
-
Respond to the following by using the graph given at the last: a. The market or equilibrium price is $????__________. b. The economic value of the 10,000th unit is $__________, and the minimum price...
-
Use the linear demand and supply curves shown below to answer the following questions: a. The market or equilibrium price is $___________.b. The economic value of the 2,000th unit is $ ___________,...
-
Table P-23 contains Southwest Airlines' quarterly income before extraordinary items ($MM) for the years 1988-1999. a. Plot the income data as a time series and describe any patterns that exist. b. Is...
-
Engine A has an efficiency of 66%. Engine B absorbs the same amount of heat from the hot reservoir and exhausts twice as much heat to the cold reservoir. (a) Which engine has the greater efficiency?...
-
How are computations carried in the three layers of multilayer perceptrons?
-
ZeeZee's Construction Company has the opportunity to select one of four projects (A, B, C, or D) or choose the null (do-nothing) alternative. Each project requires a single initial investment and has...
-
The production manager at Sunny Soda, Inc., is Interested in tracking the quality of the company% 12-ounce bottle filling line. The bottles must be filled within the tolerances set for this product...
-
The ACA expanded insurance coverage by creating health care exchanges or marketplaces. These were intended primarily for individuals that could not gain insurance through their employer. What was the...
-
Up to how much is the monopolist depicted in the accompanying graph willing to spend to protect its market position? Demonstrate your answer graphically. Price MR Demand 0 Quantity Marginal cost
-
True or false? If it were easier for consumers to collude than for suppliers to collude, there would often be shortages of goods. Why?
-
Be careful with that coffee! Your roommate is staring in disbelief at the papers in front of her. This was my contribution to our team project, she moaned. When you spilled your coffee, it splashed...
-
In mid-2015, Cisco Systems had a market capitalization of $99 billion. It had A-rated debt of $18 billion as well as cash and short-term investments of $52 billion, and its estimated equity beta at...
-
Charlie draws 5 cards out of a deck of 52. If he gets at least three of one suit, he discards the cards not of that suit and then draws until he again has 5 cards. For example, if he gets 3 hearts, 1...
-
Weston Enterprises is an all-equity firm with two divisions. The soft drink division has an asset beta of 0.53, expects to generate free cash flow of $76 million this year, and anticipates a 4%...
-
John takes the bus with probability 0.3 and the subway with probability 0.7. He is late 40% of the time when he takes the bus, but only 20% of the time when he takes the subway. What is the...
-
In a group of five items, two are defective. Find the distribution of N, the number of draws we need to find the first defective item. Find the mean and variance of N.
-
Show that y = x x1 is a solution of the differential equation xy` + y = 2x.
-
Define a traverse in Surveying?
-
1. For each of the following pairs of population groups, indicate which group has a higher poverty rate: _________ White, _________ Hispanic _________ White, _________ Asian_________ Married...
-
1. For each of the following pairs of population groups, indicate which group has a higher poverty rate: _________ White, _________ Hispanic _________ White, _________ Asian_________ Married...
-
1. For each of the following pairs of population groups, indicate which group has a higher poverty rate: _________ White, _________ Hispanic _________ White, _________ Asian_________ Married...
-
An accounting firm is always very busy in the months leading up to tax day (usually April 15). Consider a firm that has two major groups of customers: individuals and small businesses. They employ...
-
Competing in the global marketplace requires firms to select a global strategy. What strategy would you select for an international expansion of a Colorado based fast-food restaurant versus...
-
When a company uses the current rate method, which means the net investment in a foreign operation is considered to be exposed to foreign exchange risk, what are some of the characteristics? Issues?...
Study smarter with the SolutionInn App