

Draw a graph like Figure 11-12 and insert a short-run average total cost curve corresponding to a
Question:
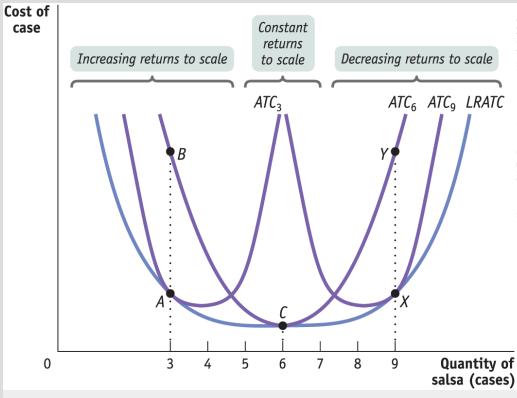
Draw a graph like Figure 11-12 and insert a short-run average total cost curve corresponding to a long-run output choice of 5 cases of salsa per day. Use the graph to show why Selena’s Gourmet Salsas should change its fixed cost if it expects to produce only 4 cases per day for a long period of time.
Figure 11-12:
Fantastic news! We've Found the answer you've been seeking!
Step by Step Answer:
The accompanying diagram shows the longrun average total cost curve LRATC and the shortrun average total cost curve corresponding to a longrun output choice of 5 cases of salsa ATC5 The curve ATC5 shows the shortrun average total cost for which the level of fixed cost minimizes average total cost at an output of 5 cases of salsa This is confirmed by the fact that at 5 cases per day ATC5 touches LRATC the longrun average total cost curve If Selenas Gourmet Salsas expects to produce only 4 cases of salsa for a long time the firm should change its fixed cost If it does not change its fixed cost and produces 4 cases of salsa the firms average total cost in the short ...View the full answer

Answered By
Ishrat Khan
Previously, I have worked as an accounting scholar at acemyhomework, and have been tutoring busines students in various subjects, mostly accounting. More specifically I'm very knowledgeable in accounting subjects for college and university level. I have done master in commerce specialising in accounting and finance as well as other business subjects.
134+ Reviews
426+ Question Solved
Related Book For 

Question Posted:
