

Use the numbers for the alcohol and tobacco category from the table in the Application Goods with
Question:
Use the numbers for the alcohol and tobacco category from the table in the Application "Goods with a Large Consumer Surplus Loss from Price Increases" to draw a figure that illustrates the roles that the revenue and the elasticity of demand play in determining the loss of consumer surplus due to an increase in price. Indicate how the various areas of your figure correspond to the equation derived in Appendix 9A and the discussion in this chapter about how a more elastic demand curve would affect consumer surplus.
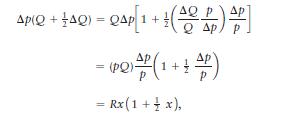
Data From Appendix 9A Equation:-
Step by Step Answer:

This question has not been answered yet.
You can Ask your question!
Related Book For 

Question Posted:
