

Using Figure 7.9 as a starting point, suppose the consumer chooses point e (spend $13 now) and
Question:
Using Figure 7.9 as a starting point, suppose the consumer chooses point e (spend $13 now) and point d (save $7). Suppose the government imposes a 20 percent tax on spending (consumption now), meaning that for every dollar spent now, $0.20 goes to the government, leaving only $0.80 to purchase products.
Figure 7.9
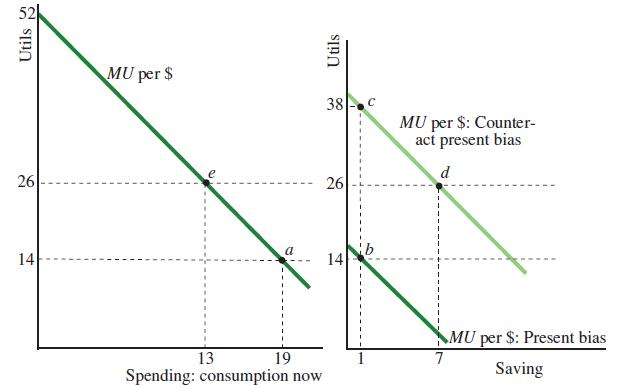
a. Use a graph to show the effect of the consumption tax on the relevant curves.
b. On your graph, show, for the initial bundle ($13, $7), the tax-induced gap between the marginal utility per dollar on spending and the marginal utility per dollar of saving.
c. Which direction will the consumer go—more spending or more saving?
Step by Step Answer:

This question has not been answered yet.
You can Ask your question!


Microeconomics Principles Applications And Tools
ISBN: 9780134078878
9th Edition
Authors: Arthur O'Sullivan, Steven Sheffrin, Stephen Perez
