

Draw a graph to show the relationship between the price and the number of umbrellas purchased, holding
Question:
Draw a graph to show the relationship between the price and the number of umbrellas purchased, holding the amount of rainfall constant at 200 mm. Describe this relationship.
The table gives data about umbrellas: price, the number purchased, and rainfall in millimetres (mm).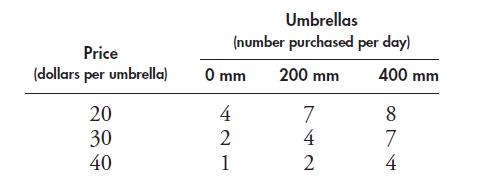
Step by Step Answer:

This question has not been answered yet.
You can Ask your question!
Related Book For 

Microeconomics Canada In The Global Environment
ISBN: 9780321931184
9th Edition
Authors: Robin Bade, Michael Parkin
Question Posted:
