

Question: Draw a graph to show the relationship between the price and the number of rides when the temperature is 20C. Describe this relationship. The table
Draw a graph to show the relationship between the price and the number of rides when the temperature is 20°C. Describe this relationship.
The table gives the price of a balloon ride, the temperature, and the number of rides a day.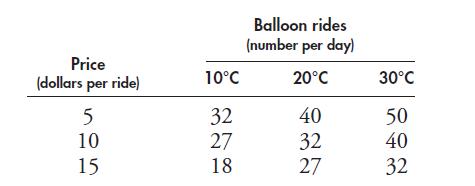
Price (dollars per ride) 5 10 15 10C 32 27 18 Balloon rides (number per day) 20C 40 32 27 30C 50 40 32
Step by Step Solution
★★★★★
3.22 Rating (160 Votes )
There are 3 Steps involved in it
1 Expert Approved Answer
Step: 1 Unlock

I can provide a description of the graph since Im not able to create visual content To graph the rel... View full answer
Question Has Been Solved by an Expert!
Get step-by-step solutions from verified subject matter experts
Step: 2 Unlock
Step: 3 Unlock