

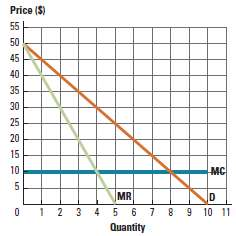
Figure 14P-1 presents the demand curve, marginal revenue, and marginal costs facing a monopolist producer. a. What
Question:
a. What is the profit-maximizing level of output?
b. What price will the monopolist charge for the quantity in part a?
c. Plot the profit-maximizing price and quantity from parts a and b on the graph.
d. What are the efficiency costs (deadweight loss) of monopoly output/pricing? Provide a numerical answer and illustrate this area on the graph.
e. What is consumer surplus under monopoly output/pricing? Illustrate this area on the graph.
Figure 14P-1:
Fantastic news! We've Found the answer you've been seeking!
Step by Step Answer:
a The profitmaximizing level of output is 4 because this is where MR MC b The monopolist will cha...View the full answer

Answered By
Ajay Negi
Hi, I've completed my degree in engineering (Information Technology) from an NIT. Currently working as a software engineer. Wish to impart quality education to the future generation.
2+ Reviews
10+ Question Solved
Related Book For 
Question Posted:
