

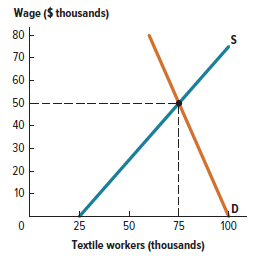
Figure 16P-2 shows the supply and demand for labor in the textile industry. In each of the
Question:
a. What are the original equilibrium wage and quantity?
b. Immigration and layoffs from other jobs increase the population of textile workers.
c. A new technology for making self-printed T-shirts reduces the marginal product of labor for textile workers.
Figure 16P-2:
Fantastic news! We've Found the answer you've been seeking!
Step by Step Answer:
a The equilibrium occurs where supply intersects demand This is at 75000 textile w...View the full answer

Answered By
Seema kuldeep
although I don't have an experience of teaching in a particular institute, previously I was an expert on Chegg and I have used to teach my batch mates and also my juniors.
1+ Reviews
10+ Question Solved
Related Book For 

Question Posted:
