

The diagram below shows supply and demand curves in the Canadian market for soybeans. The free market
Question:
The diagram below shows supply and demand curves in the Canadian market for soybeans. The free market equilibrium and quantity are p* and Q*.
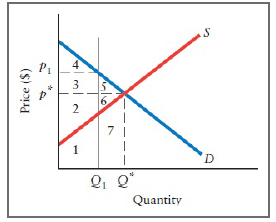
a. If the price of soybeans is at its market-clearing equilibrium level, p*, identify the areas on the graph that sum to this market?s total economic surplus.
b. Suppose the government imposes an output quota at Identify the areas on the graph that represent the reduction in economic surplus as a result of this government?s imposition of the quota.
c. Describe the effect of this quota on market efficiency. Is society as a whole better off?
Fantastic news! We've Found the answer you've been seeking!
Step by Step Answer:
a With the marketclearing price of p and quantity Q the total ...View the full answer

Answered By
Utsab mitra
I have the expertise to deliver these subjects to college and higher-level students. The services would involve only solving assignments, homework help, and others.
I have experience in delivering these subjects for the last 6 years on a freelancing basis in different companies around the globe. I am CMA certified and CGMA UK. I have professional experience of 18 years in the industry involved in the manufacturing company and IT implementation experience of over 12 years.
I have delivered this help to students effortlessly, which is essential to give the students a good grade in their studies.
2+ Reviews
10+ Question Solved
Related Book For 

Question Posted:
