

The diagrams below show the supply and demand curves in the market for widgets. In each diagram
Question:
The diagrams below show the supply and demand curves in the market for widgets. In each diagram the free market equilibrium price and quantity are p* and Q*.
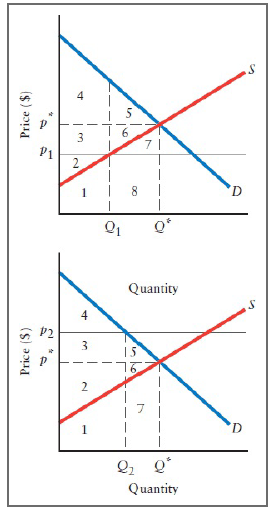
a. In the first diagram, if the price of widgets is at its marketclearing equilibrium level, p*, identify the areas on the graph that sum to this market?s total economic surplus.
b. In the first diagram, suppose the government imposes a price ceiling at price p*. Identify the areas on the graph that represent the reduction in economic surplus as a result of this price control.
c. In the second diagram, if the price of widgets is at its market-clearing equilibrium level, p*, identify the areas on the graph that sum to this market?s total economic surplus.
d. In the second diagram, suppose the government imposes a price floor at price p*. Identify the areas on the graph that represent the reduction in economic surplus as a result of this price control.
e. For both diagrams, describe the effect on market efficiency of the price controls. Is society as a whole better off?
Step by Step Answer:
a With price p and quantity Q the total economic surplus is given by areas 23456 the area below the ...View the full answer


