

Question: Use the market represented in Figure 5P-2 to plot the equilibrium price and quantity and to draw the consumer surplus when the market is in
Use the market represented in Figure 5P-2 to plot the equilibrium price and quantity and to draw the consumer surplus when the market is in equilibrium. What is the value of consumer surplus at the equilibrium price?
Figure 5P-2:
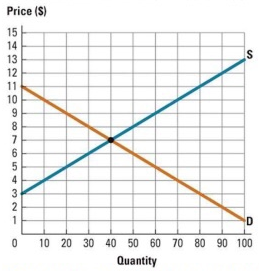
Price (S) 15 14 13 12 11 10 8. 0 10 20 30 40 50 60 70 80 90 100 Quantity -654 321
Step by Step Solution
★★★★★
3.47 Rating (163 Votes )
There are 3 Steps involved in it
1 Expert Approved Answer
Step: 1 Unlock

The equilibrium price is 7 The consumer surplus is the area ... View full answer
Question Has Been Solved by an Expert!
Get step-by-step solutions from verified subject matter experts
Step: 2 Unlock
Step: 3 Unlock