

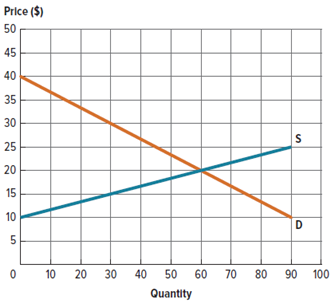
Use the market represented in Figure 5P-4 to draw the consumer and producer surplus when the market
Question:
Figure 5P-4:
Fantastic news! We've Found the answer you've been seeking!
Step by Step Answer:
The total surplus is equal to the sum of consumer and producer surplus We can calc...View the full answer

Answered By
Shadrack Mulunga
I am a Biochemistry by profession. However, I have explored different fields of study. My quest to explore new fields has helped me gain new knowledge and skills in Business, clinical psychology, sociology, organizational behavior and general management, and Project Management. I count my expertise in Project management, in particular, creation of Work Break Down Structure (WBS) and use of Microsoft Project software as one of my greatest achievement in Freelancing industry. I have helped thousands of BSC and MSC students to complete their projects on time and cost-effectively using the MS Project tool. Generally, I find happiness in translating my knowledge and expertise to success of my clients. So far, i have helped thousands of students to not only complete their projects in time but also receive high grades in their respective courses. Quality and timely delivery are the two key aspects that define my work. All those who hired my services always come back for my service. If you hire my services today, you will surely return for more. Try me today!
154+ Reviews
289+ Question Solved
Related Book For 

Question Posted:
