

Question: (a) Fill in Table 2. (b) Using your own piece of graph paper, draw a graph of the firms demand, marginal revenue, marginal cost,
(a) Fill in Table 2.
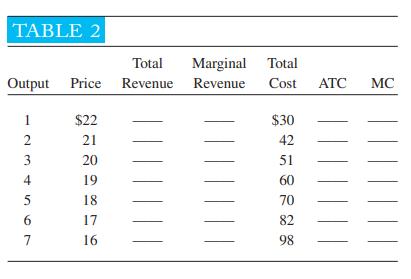
(b) Using your own piece of graph paper, draw a graph of the firm’s demand, marginal revenue, marginal cost, and average total cost curves.
(c) Calculate the firm’s total profit.
(d) If the firm operates at optimum efficiency, how much will its output be?
(e) If the firm were a perfect competitor, how much would its price be in the long run?
TABLE 2 Total Marginal Total Output Price Revenue Revenue Cost 1 2 3 4 5 6 7 $22 21 20 19 18 17 16 $30 42 51 60 70 82 98 ATC MC
Step by Step Solution
★★★★★
3.39 Rating (149 Votes )
There are 3 Steps involved in it
1 Expert Approved Answer
Step: 1 Unlock

Question Has Been Solved by an Expert!
Get step-by-step solutions from verified subject matter experts
Step: 2 Unlock
Step: 3 Unlock