

a) In Figure 6, if the demand curve is D 1 , how much are equilibrium price
Question:
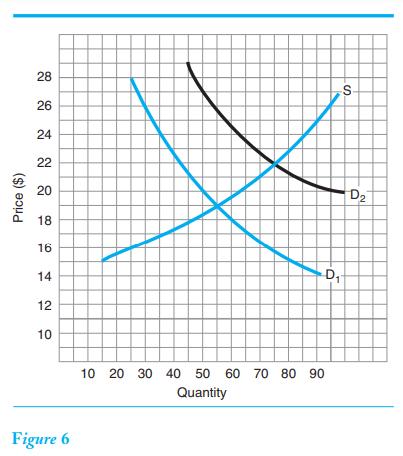
a) In Figure 6, if the demand curve is D1 , how much are equilibrium price and quantity? b) If demand changes from D1 to D2 , does that represent an increase or decrease in demand? c) How much are the new equilibrium price and quantity?
Fantastic news! We've Found the answer you've been seeking!
Step by Step Answer:

Answered By
Fahmin Arakkal
Tutoring and Contributing expert question and answers to teachers and students.
Primarily oversees the Heat and Mass Transfer contents presented on websites and blogs.
Responsible for Creating, Editing, Updating all contents related Chemical Engineering in
latex language
8+ Reviews
22+ Question Solved
Related Book For 

Question Posted:
