

Question: Use the following data for the exercises below. a. What is the equilibrium price and quantity? b. Draw the demand and supply curves. If this
Use the following data for the exercises below.
a. What is the equilibrium price and quantity?
b. Draw the demand and supply curves. If this represents perfect competition, are the curves individual-firm or market curves? How is the quantity supplied derived?
c. Show the consumer surplus. Show the producer surplus.
d. Suppose that a price ceiling of \($12\) was imposed. How would this change the consumer and producer surplus? Suppose a price floor of \($16\) was imposed. How would this change the consumer and producer surplus?
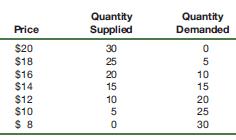
Price Quantity Supplied Quantity Demanded $20 30 0 $18 25 5 $16 20 10 $14 15 15 $12 10 20 $10 5 25 $ 8 0 30
Step by Step Solution
3.51 Rating (154 Votes )
There are 3 Steps involved in it
a What is the Equilibrium Price and Quantity The equilibrium is where quantity demanded quantity supplied Looking at the table PriceSuppliedDemanded 1... View full answer

Get step-by-step solutions from verified subject matter experts