

Question: Use the geometric mean to estimate the mean annual return on stocks, bonds, and T-bills in the file named Historicalinvest.xlsx. 6 7 Year 8 9
Use the geometric mean to estimate the mean annual return on stocks, bonds, and T-bills in the file named Historicalinvest.xlsx.
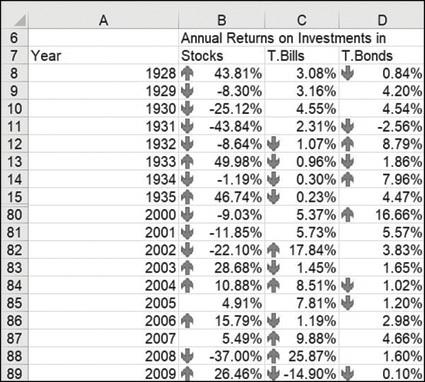
6 7 Year 8 9 10 11 12 13 14 15 80 81 82 83 84 85 86 87 88 89 A 1928 1929 1930 1931 1932 43.81% 3.08% -8.30% 3.16% -25.12% 4.55% -43.84% 2.31% -8.64% 1.07% 1933 49.98% 0.96% 1934 -1.19% 0.30% 1935 46.74% 0.23% -9.03% 5.37% -11.85% 5.73% -22.10% 17.84% 28.68% 1.45% 10.88% 8.51% 4.91% 7.81% 15.79% 1.19% 5.49% 9.88% -37.00% 25.87% 26.46% -14.90% 2000 2001 2002 2003 B C D Annual Returns on Investments in Stocks T.Bills T.Bonds 2004 2005 2006 2007 2008 2009 0.84% 4.20% 4.54% -2.56% 8.79% 1.86% 7.96% 4.47% 16.66% 5.57% 3.83% 1.65% 1.02% 1.20% 2.98% 4.66% 1.60% 0.10%
Step by Step Solution
3.51 Rating (174 Votes )
There are 3 Steps involved in it

Get step-by-step solutions from verified subject matter experts