

Question: Using the data in the file named Sandp.xlsx, use conditional formatting in the following situations: Format in bold each month in which the value of
Using the data in the file named Sandp.xlsx, use conditional formatting in the following situations:
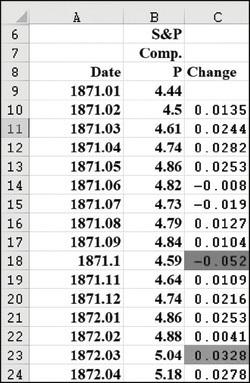
Format in bold each month in which the value of the S&P index increased, and format with an underline each month in which the value of the S&P index decreased.
Highlight in green each month in which the S&P index changed by a maximum of 2 percent.
Highlight the largest S&P index value in red and the smallest in purple.
67 6 7 8 9 10 11 12 13 14 15 16 17 18 19 20 21 22 23 24 A Date 1871.01 1871.02 1871.03 1871.04 1871.05 1871.06 1871.07 1871.08 1871.09 1871.1 1871.11 1871.12 1872.01 1872.02 1872.03 1872.04 B S&P Comp. P Change 4.44 4.5 0.0135 4.61 0.0244 4.74 0.0282 4.86 0.0253 4.82 -0.008 4.73 -0.019 4.79 0.0127 4.84 0.0104 4.59 -0.052 4.64 0.0109 4.74 0.0216 4.86 0.0253 4.88 0.0041 5.04 0.0328 5.18 0.0278
Step by Step Solution
3.39 Rating (168 Votes )
There are 3 Steps involved in it
To use conditional formatting in Excel to achieve the specified formatting follow these steps 1 Form... View full answer

Get step-by-step solutions from verified subject matter experts