

Question: 12. In the profit-volume chart below, EF and GH represent the profit-volume graphs of a single-product company for 2007 and 2008, respectively. If 2007 and
12. In the profit-volume chart below, EF and GH represent the profit-volume graphs of a single-product company for 2007 and 2008, respectively.
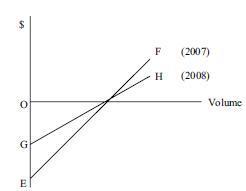 If 2007 and 2008 unit sales prices are identical, how did total fixed costs and unit variable costs of 2008 change compared to 2007? 2008 total 2008 unit fixed costs variable costs
a. Decreased Increased
b. Decreased Decreased
c. Increased Increased
d. Increased Decreased
G E F (2007) H (2008) Volume
Step by Step Solution
There are 3 Steps involved in it
1 Expert Approved Answer
Step: 1 Unlock

Question Has Been Solved by an Expert!
Get step-by-step solutions from verified subject matter experts
Step: 2 Unlock
Step: 3 Unlock