Question:
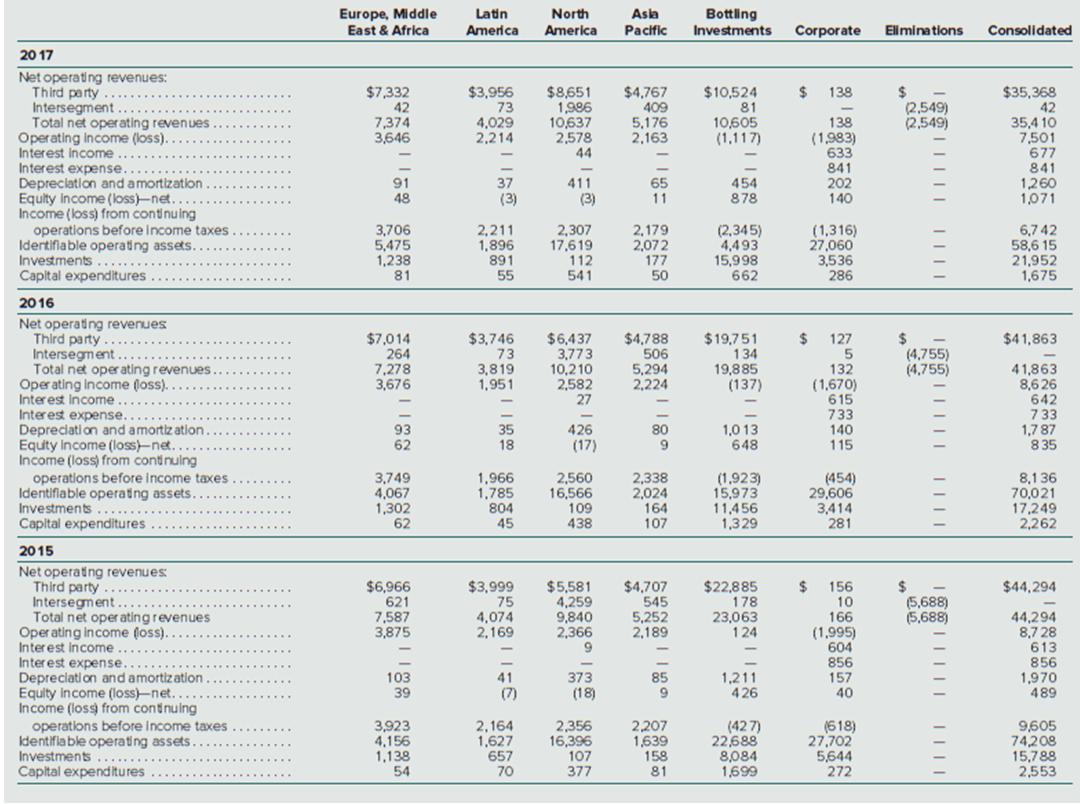
The Coca-Cola Company is organized geographically and defines reportable operating segments as regions of the world. The following information was extracted from Note 19 Operating Segments in the Coca-Cola Company 2017 Annual Report:
Required
1. Calculate the following measures for each of Coca-Cola’s operating segments (excluding Bottling Investments and Corporate):
∙ Percentage of total net operating revenues, 2016 and 2017.
∙ Percentage change in total net operating revenues, 2015 to 2016 and 2016 to 2017.
∙ Operating income as a percentage of total net operating revenues (profit margin), 2013 and 2014.
2. Determine whether you believe Coca-Cola should attempt to expand its operations in a particular region of the world to increase net operating revenues and operating income.
3. List any additional information you would like to have to conduct your analysis.
Transcribed Image Text:
Europe, Middle Latin America Bottling Investments North Asia East & Africa America Pacific Coгporate Eliminations Consolidated 20 17 Net operating revenues: Third party Intersegment. Total net oper ating revenues Operating income (loss). Interest Income $3,956 73 4,029 2,214 $4,767 409 5,176 2,163 $7,332 42 $35,368 42 $8,651 1,986 10,637 2,578 44 $10,524 81 10,605 (1,117) %24 %24 (2,549) (2,549) 138 7,374 3,646 138 (1,983) 633 35,4 10 7,501 677 Interest expense. Depreciation and amortization Equity income (loss)-net. Income (loss) from continuing operations before Income taxes Idertifiable operating assets. Investments Capital expenditures 454 878 841 202 140 841 1,260 1,071 91 37 411 65 11 48 (3) (3) 3,706 5,475 1,238 81 2,211 1,896 891 55 2,307 17,619 112 541 2,179 2,072 177 50 (2,345) 4,493 15,998 662 (1,316) 27,060 3,536 286 6,7 42 58,6 15 21,952 1,675 ... ... 2016 Net operating revenues Third party Intersegment..... Total net oper ating revenues Oper ating income (loss). Interest Income Interest expense. Depreciati on and amortiz ation. Equty Income (loss)-net. Income (loss) from continulng operations before income taxes Identifiable operating assets. Investments...... Capital expenditures $19,751 134 19,885 (137) 24 $7,014 264 7,278 3,676 $3,746 73 3,819 1,951 $6,437 3,773 10,210 2,582 27 $4,788 506 %24 (4,755) (4,755) 127 $41,863 132 (1,670) 615 733 140 115 41,863 8,6 26 642 733 1,7 87 835 5,294 2,224 93 62 35 18 426 80 9. 1,0 13 648 (17) 3,749 4,067 1,302 62 1,966 1,785 804 45 2,560 16,566 109 438 2,338 2.024 164 107 (1,923) 15,973 11,456 1,329 (454) 29,606 3,414 281 8,1 36 70,021 17,249 2,262 2015 Net operating revenues Third party Intersegment. Total net oper ating revenues Oper ating income (loss). Interest income Interest expense. Depreciati on and amortization Equilty Income (loss)-net. Income (loss from contnuing operations before Income taxes Identiflable operating assets. $6,966 621 7,587 3,875 $4,707 545 5,252 2,189 $3,999 75 $5,581 4,259 9,840 2,366 $22,885 178 23,063 124 %24 $44,294 156 10 24 (5,688) (5,688) 44,294 8,7 28 613 856 1,970 489 4,074 2,169 166 (1,995) 604 856 157 40 103 39 1,211 426 41 373 85 9. (7) (18) 3,923 4,156 1,138 54 2,164 1,627 657 70 2,356 16,396 2,207 1,639 158 81 (42 7) 22,688 8,084 1,699 (618) 27,702 5,644 272 9,605 74208 15,788 2,553 Investments 107 377 Capital expenditures 1111