

Question: E8.10 The dynamic analyzer shown in Figure E8.10(a) can be used to display the frequency response of a system. Also shown is the signal analyzer
E8.10 The dynamic analyzer shown in Figure E8.10(a)
can be used to display the frequency response of a system. Also shown is the signal analyzer used to measure the mechanical vibration in the cockpit of an automobile. Figure E8.10
(b) shows the actual frequency response of a system. Estimate the poles and zeros of the device. Note X = 1.37 kHz at the first cursor, and X = 1.257 kHz to the second cursor.
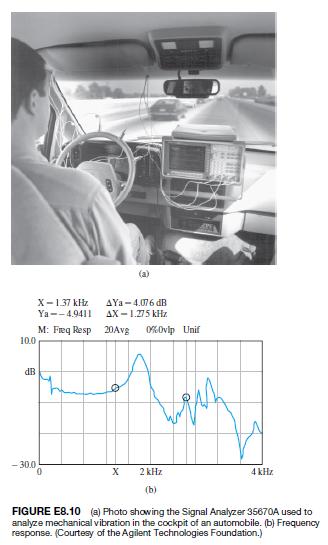
10.0 dB -30.0 (B) X-1.37 kHz AYa-4.076 dB Ya--4.9411 AX-1.275 kHz M: Freq Resp 20Avg 0% Ovlp Unif X 2 kHz (b) 4 kHz FIGURE E8.10 (a) Photo showing the Signal Analyzer 35670A used to analyze mechanical vibration in the cockpit of an automobile. (b) Frequency response. (Courtesy of the Agilent Technologies Foundation.)
Step by Step Solution
There are 3 Steps involved in it

Get step-by-step solutions from verified subject matter experts