

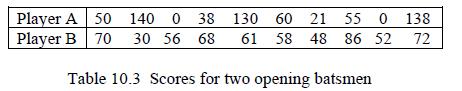
1. In a five-match test series, the runs scored by the two opening batsmen were as given...
Question:
1. In a five-match test series, the runs scored by the two opening batsmen were as given in Table 10.3. Calculate the mean score over the series for each batsman.
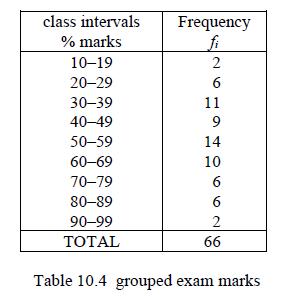
2. The grouped data of Table 10.4 represents the percentage marks scored by 66 candidates in an examination. Calculate the mean percentage mark.
3. The heights of a sample of 20 plants were measured to the nearest millimetre. The results were as given in Table 10.5.
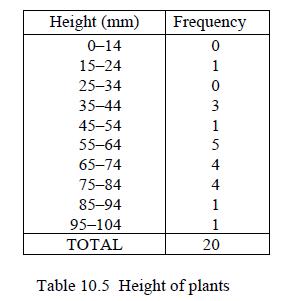
Calculate the mean height.
Fantastic news! We've Found the answer you've been seeking!
Step by Step Answer:
1 Playe...View the full answer

Answered By
Muhammad Umair
I have done job as Embedded System Engineer for just four months but after it i have decided to open my own lab and to work on projects that i can launch my own product in market. I work on different softwares like Proteus, Mikroc to program Embedded Systems. My basic work is on Embedded Systems. I have skills in Autocad, Proteus, C++, C programming and i love to share these skills to other to enhance my knowledge too.
1+ Reviews
10+ Question Solved
Related Book For 

Question Posted:
