

Question: Using the data in Figure 13.4: (a) Draw two histograms of temperatures for engine A, first with class boundaries at even numbers, then with boundaries
Using the data in Figure 13.4:
(a) Draw two histograms of temperatures for engine A, first with class boundaries at even numbers, then with boundaries at multiples of five;
(b) Draw a cumulative percentage plot for the running time data for engine A and compare it with a similar plot for engine B.
Figure 13.4
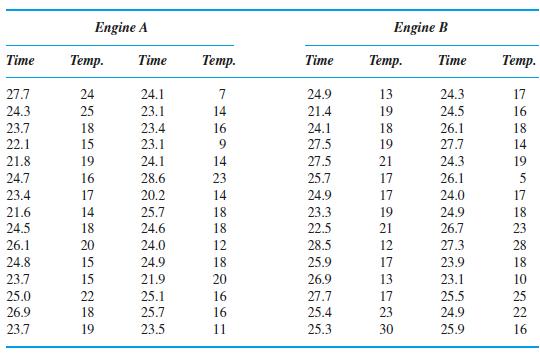
Time 27.7 24.3 23.7 22.1 21.8 24.7 23.4 21.6 24.5 26.1 24.8 23.7 25.0 26.9 23.7 Engine A Temp. Time 24 25 18 15 19 16 17 14 18 20 15 15 22 18 19 24.1 23.1 23.4 23.1 24.1 28.6 20.2 25.7 24.6 24.0 24.9 21.9 25.1 25.7 23.5 Temp. 7 14 16 9 14 23 14 18 18 12 18 20 16 16 11 Time 24.9 21.4 24.1 27.5 27.5 25.7 24.9 23.3 22.5 28.5 25.9 26.9 27.7 25.4 25.3 Engine B Temp. Time 13 19 18 19 21 17 17 19 21 12 17 13 17 23 30 24.3 24.5 26.1 27.7 24.3 26.1 24.0 24.9 26.7 27.3 23.9 23.1 25.5 24.9 25.9 Temp. 17 16 18 14 19 5 17 18 23 28 18 10 25 22 16
Step by Step Solution
3.41 Rating (164 Votes )
There are 3 Steps involved in it
a A histogram with class boundaries at even numbers A his... View full answer

Get step-by-step solutions from verified subject matter experts