

Question: Using the data for ionic and metallic crystals from Table 10-1, (a) Graph cohesive energy versus melting point and put the best straight line through
Using the data for ionic and metallic crystals from Table 10-1,
(a) Graph cohesive energy versus melting point and put the best straight line through the points.
(b) Determine the cohesive energies of cobalt, silver, and sodium, whose melting temperatures are 1495°C, 962°C, and 98°C, respectively. (The measured values are cobalt 4.43 eV, silver 2.97 eV, and sodium 1.13 eV.)
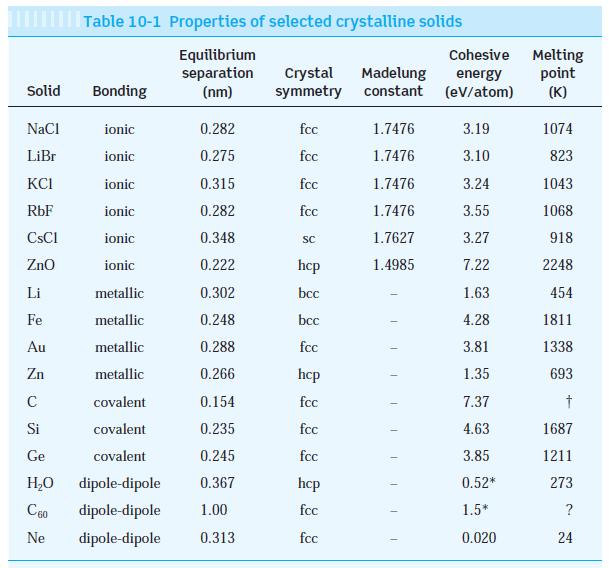
Solid NaCl LiBr KCI RbF ionic 0.282 ionic 0.275 ionic 0.315 ionic 0.282 ionic 0.348 ionic 0.222 metallic 0.302 metallic 0.248 metallic 0.288 metallic 0.266 covalent 0.154 covalent 0.235 Ge covalent 0.245 HO dipole-dipole 0.367 C60 dipole-dipole 1.00 Ne dipole-dipole 0.313 CsCl ZnO Table 10-1 Properties of selected crystalline solids Equilibrium separation (nm) Li Fe Au Zn C Si Bonding Crystal Madelung symmetry constant fcc fcc fcc fcc SC hcp bcc bcc fcc hcp fcc fcc fcc hcp fcc fcc 1.7476 1.7476 1.7476 1.7476 1.7627 1.4985 T 1 T Cohesive Melting energy (eV/atom) point (K) 3.19 3.10 3.24 3.55 3.27 7.22 1.63 4.28 3.81 1.35 7.37 4.63 3.85 0.52* 1.5* 0.020 1074 823 1043 1068 918 2248 454 1811 1338 693 1687 1211 273 ? 24
Step by Step Solution
3.34 Rating (151 Votes )
There are 3 Steps involved in it
a b Noting that the melting points are in kelvins on the gr... View full answer

Get step-by-step solutions from verified subject matter experts