

Question: Create an adsorption experiment report according to the data table in the leaflet. ADSORPTION FROM SOLUTION Introduction The term adsorption is used to descrihe the
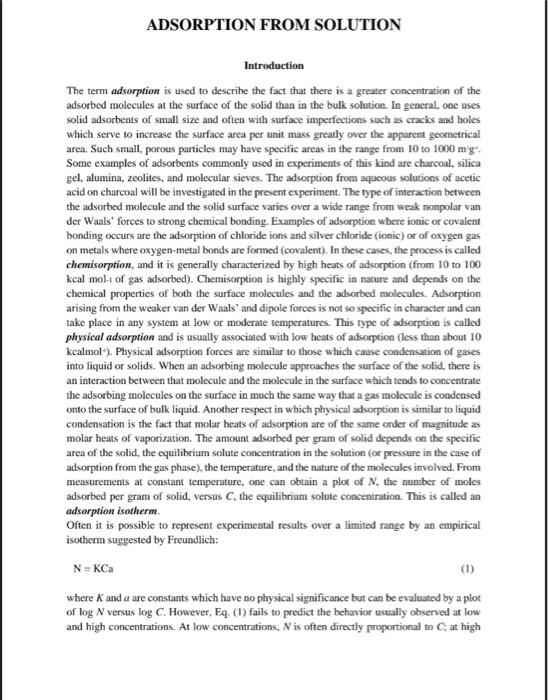
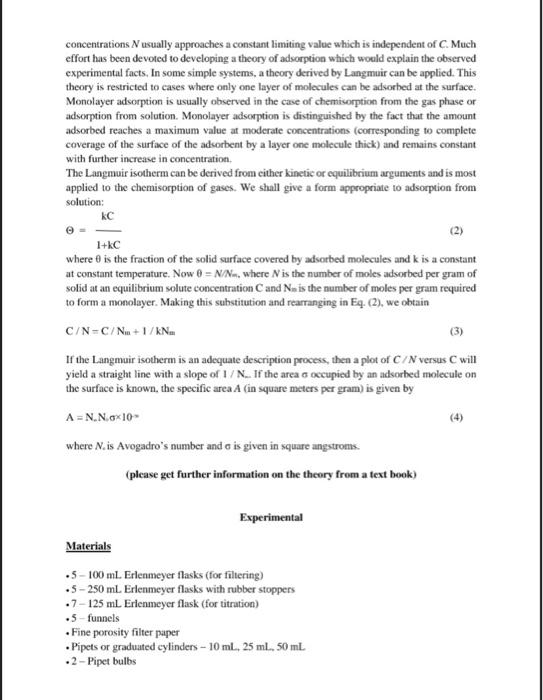
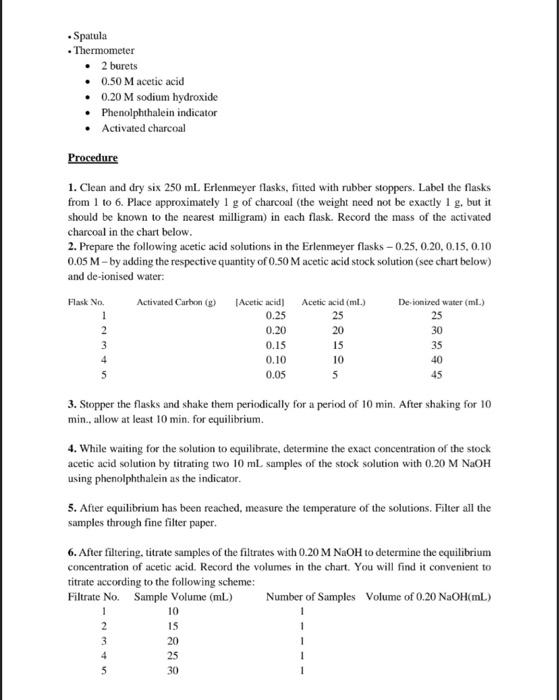
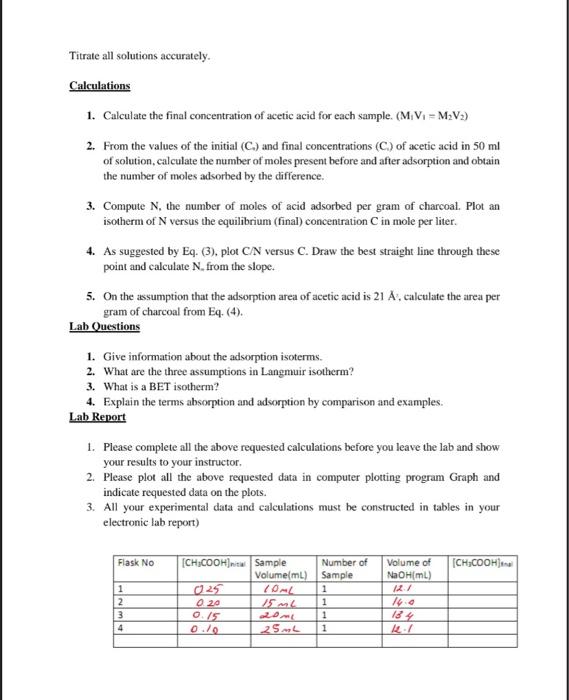
ADSORPTION FROM SOLUTION Introduction The term adsorption is used to descrihe the fact that there is a greater concentration of the adsorbed molecules at the surface of the solid than in the bulk solution. In gencral, one uses solid adsorbeats of small size and often with surface imperfections such as cracks and holes which serve to increase the surface area per unit mass greatly over the apparent geometrical area. Such small, porous particles may have specific areas in the range from 10 to 1000mgg. Some examples of adsorbents commonly used in experiments of this kind are charcoal, silica gel, alumina, zeolites, and molecular sieves. The adsorption frorn aqueous solutions of acetic acid on charcoal will be investigated in the present experiment. The type of interaction between the adsorbed molecule and the solid surface varies over a wide range from weak nonpolar van der Waals' forces to strong chemical bonding. Examples of adsorption where ionic or covalent bonding occurs are the adsorption of chloride ions and silver chloride (ionic) or of oxygen gas on metals where oxygen-metal bonds are formed (covalent). In these cases, the process is called chemisorption, and it is generally characterized by high heats of adsorption (from 10 to 100 kcal mol-t of gas adsorbed). Chemisorption is highly specific in nature and depends on the chemical properties of both the surface molecules and the adsorbed molecules. Adsorption arising from the weaker van der Waals' and dipole forces is not so specific in character and can take place in any system at low or moderate temperatures. This type of adsorption is called physical adsorption and is usually associated with low heats of adsorption (less than about 10 kcalmol'). Physical adsorption forces are similar to those which cause condensation of gases into liquid or solids. When an adsorbing molecule approaches the surface of the solid, there is an interaction between that molecule and the molecule in the surface which tends to concentrate the adsorbing molecules on the surface in much the same way that a gas molecule is condensed onto the surface of bulk liquid. Another respect in which physical adsorption is similar to liquid condensation is the fact that molar heats of adsorption are of the same order of magnitude as molar heats of vaporization. The amount adsorbed per gram of solid depends on the specific area of the solid, the equilibrium solute concentration in the solution (or pressure in the case of adsorption from the gas phase), the temperature, and the nature of the molecules involved. From measurements at constant temperature, one can obtain a plot of N. the number of moles adsorbed per gram of solid, versus C, the equilibrium solute concentration. This is called an adsorption isotherm. Often it is possible to represent experimental results over a limited range by an empirical isotherm suggested by Freundlich: N=KCa where K and a are constants which have no physical significance but can be evaluated by a plot of logN versus logC. However, Eq. (1) fails to predict the behavior usually observed at low and high concentrations. At low concentrations, N is often directly proportional to C, at high concentrations N usually approaches a constant limiting value which is independent of C. Much effort has been devoted to developing a theory of adsorption which would explain the observed experimental facts. In some simple systems, a theory derived by Langmuir can be applied. This theory is restricted to cases where only one layer of molecules can be adsorbed at the surface. Monolayer adsorption is usually observed in the case of chemisorption from the gas phase or adsorption from solution. Monolayer adsorption is distinguished by the fact that the amount adsorbed reaches a maximum value at moderate concentrations (corresponding to complete coverage of the surface of the adsorbent by a layer one molecule thick) and remains constant with further increase in concentration. The Laagmuir isotherm can be derived from cither kinetic or equilibrium arguments and is most applied to the chemisorption of gases. We shall give a form appropriate to adsorption from solution: kC =1+kC where is the fraction of the solid surface covered by adsorbed molecules and k is a constant at constant temperature. Now =N/Nm, where N is the number of moles adsorbed per gram of solid at an equilibrium solute concentration C and Nm is the number of moles per gram required to form a monolayer. Making this substitution and rearranging in Eq. (2), we obtain C/N=C/Nm+1/kNm If the Langmuir isotherm is an adequate description process, then a plot of C/N versus C will yield a straight line with a slope of 1/N. If the area occupied by an adsorbed molecule on the surface is known, the specific area A (in square meters per gram) is given by A=NNax10 where Nt is Avogadro's number and is given in square angstroms. (please get further information on the theory from a text book) Experimental Materials - 5100mL Erlenmeyer flasks (for filtering) - 5 - 250mL Erlenmeyer flasks with rubber stoppers .7125mL Erienmeyer flask (for titration) .5 - funnels - Fine porosity filter paper - Pipets or graduated cylinders 10mL,25mL,50mL .2-Pipet bulbs - Spatula - Thermometer - 2 burets - 0.50M acetic acid - 0.20M sodium hydroxide - Phenolphthalein indicator - Activated charcoal Procedure 1. Clean and dry six 250mL Erlenmeyer flasks, fitted with rubber stoppers. Label the flasks from 1 to 6 . Place approximately 1g of charcoal (the weight need not be exactly 1g, but it should be known to the nearest milligram) in each flask. Record the mass of the activated charcoal in the chart below. 2. Prepare the following acetic acid solutions in the Erlenmeyer flasks 0.25,0.20,0.15,0,10 0.05M - by adding the respective quantity of 0.50M acetic acid stock solution (see chart below) and de-ionised water: 3. Stopper the flasks and shake them periodically for a period of 10min. After shaking for 10 min. allow at least 10min. for equilibrium. 4. While waiting for the solution to equilibrate, determine the exact concentration of the stock acetic acid solution by titrating two 10mL samples of the stock solution with 0.20MNaOH using phenolphthalein as the indicator. 5. After equilibrium has been reached, measure the temperature of the solutions. Filter all the samples through fine filter paper. 6. After filtering, titrate samples of the filtrates with 0.20MNaOH to determine the equilibrium concentration of acetic acid. Record the volumes in the chart. You will find it convenient to titrate according to the following scheme: Titrate all solutions accurately. Calculations 1. Calculate the final concentration of acetic acid for each sample. (M1V1=M2V2) 2. From the values of the initial (C2) and final concentrations (C2) of acetic acid in 50ml of solution, calculate the number of moles present before and after adsorption and obtain the number of moles adsorbed by the difference. 3. Compute N, the number of moles of acid adsorbed per gram of charcoal. Plot an isotherm of N versus the equilibrium (final) concentration C in mole per liter. 4. As suggested by Eq. (3), plot CN versus C. Draw the best straight line through these point and calculate Nfrom the slope. 5. On the assumption that the adsorption area of acetic acid is 21A, calculate the area per gram of charcoal from Eq. (4). Lab Questions 1. Give information about the adsorption isoterms. 2. What are the three assumptions in Langmuir isotherm? 3. What is a BET isotherm? 4. Explain the terms absorption and advorption by comparison and examples. Lab Report 1. Please complete all the above requesied calculations before you leave the lab and show your results to your instructor. 2. Please plot all the above requested data in computer plotting program Graph and indicate requested data on the plots. 3. All your experimental data and calculations must be constructed in tables in your electronic lab report)
Step by Step Solution
There are 3 Steps involved in it

Get step-by-step solutions from verified subject matter experts