

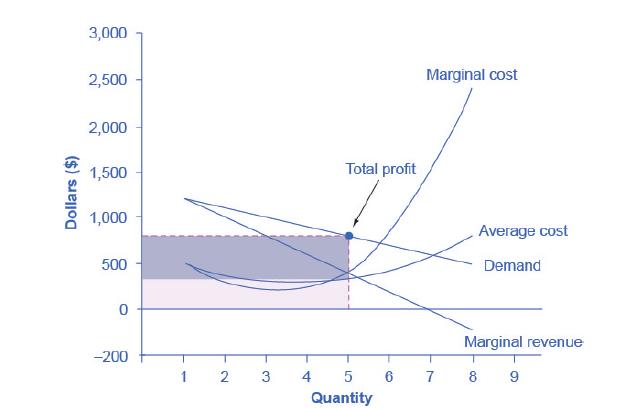
Draw the demand curve, marginal revenue, and marginal cost curves from Figure 9.6, and identify the quantity
Question:
Draw the demand curve, marginal revenue, and marginal cost curves from Figure 9.6, and identify the quantity of output the monopoly wishes to supply and the price it will charge. Suppose demand for the monopoly’s product increases dramatically. Draw the new demand curve. What happens to the marginal revenue as a result of the increase in demand? What happens to the marginal cost curve? Identify the new profit-maximizing quantity and price. Does the answer make sense to you?
Figure 9.6
Fantastic news! We've Found the answer you've been seeking!
Step by Step Answer:
A sketch of the demand curve marginal revenue curve and marginal cost curve from Figure 96 MR Price ...View the full answer

Answered By
PALASH JHANWAR
I am a Chartered Accountant with AIR 45 in CA - IPCC. I am a Merit Holder ( B.Com ). The following is my educational details.
PLEASE ACCESS MY RESUME FROM THE FOLLOWING LINK: https://drive.google.com/file/d/1hYR1uch-ff6MRC_cDB07K6VqY9kQ3SFL/view?usp=sharing
3+ Reviews
10+ Question Solved
Related Book For 

Question Posted:
