

Return to Figure 9.2. Suppose P 0 is $10 and P 1 is $11. Suppose a new
Question:
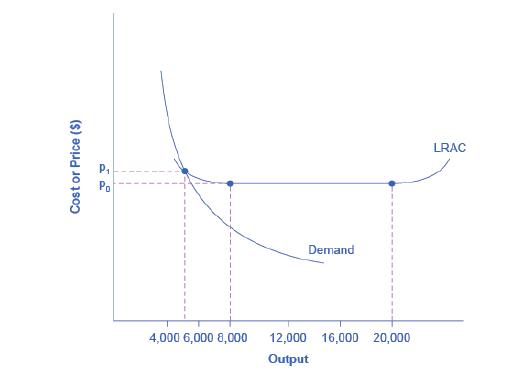
Return to Figure 9.2. Suppose P0 is $10 and P1 is $11. Suppose a new firm with the same LRAC curve as the incumbent tries to break into the market by selling 4,000 units of output. Estimate from the graph what the new firm’s average cost of producing output would be. If the incumbent continues to produce 6,000 units, how much output would the two firms supply to the market? Estimate what would happen to the market price as a result of the supply of both the incumbent firm and the new entrant. Approximately how much profit would each firm earn?
Figure 9.2
Fantastic news! We've Found the answer you've been seeking!
Step by Step Answer:
From Figure 92 locate the LRAC curve and find the point corresponding to 4000 units of output Then read the cost or price associated with this quantit...View the full answer

Answered By
Utsab mitra
I have the expertise to deliver these subjects to college and higher-level students. The services would involve only solving assignments, homework help, and others.
I have experience in delivering these subjects for the last 6 years on a freelancing basis in different companies around the globe. I am CMA certified and CGMA UK. I have professional experience of 18 years in the industry involved in the manufacturing company and IT implementation experience of over 12 years.
I have delivered this help to students effortlessly, which is essential to give the students a good grade in their studies.
2+ Reviews
10+ Question Solved
Related Book For 
Question Posted:
