

Table 24.4 describes Santher's economy. Table 24.4 a. Plot the AD/AS curves and identify the equilibrium. b.
Question:
Table 24.4 describes Santher's economy.
Table 24.4
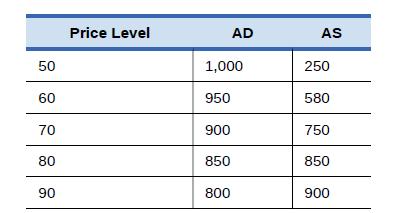
a. Plot the AD/AS curves and identify the equilibrium.
b. Would you expect unemployment in this economy to be relatively high or low?
c. Would you expect prices to be a relatively large or small concern for this economy?
d. Imagine that input prices fall and so AS shifts to the right by 150 units. Identify the new equilibrium.
e. How will the shift in AS affect the original output, price level, and employment?
Fantastic news! We've Found the answer you've been seeking!
Step by Step Answer:
a To plot the ADAS curves and identify the equilibrium we use the data provided in Table 244 Aggrega...View the full answer

Answered By
Branice Buyengo Ajevi
I have been teaching for the last 5 years which has strengthened my interaction with students of different level.
1+ Reviews
10+ Question Solved
Related Book For 

Question Posted:
