

Assign the H 2 pure rotational transitions in Figure 8.8, using data from Table 9.2 to calculate
Question:
Assign the H2 pure rotational transitions in Figure 8.8, using data from Table 9.2 to calculate the predicted frequencies. Assuming the spectra were taken at room temperature, account for the relative intensities of each transition.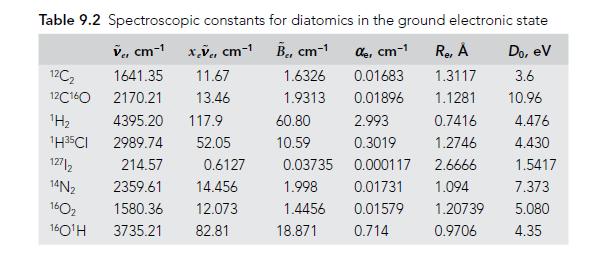
Figure 5.8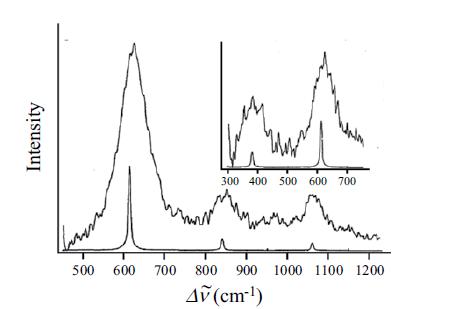
Fantastic news! We've Found the answer you've been seeking!
Step by Step Answer:
Using the information from Table 92 we can assign the pure rotational transitions for H2 First we mu...View the full answer

Answered By
Allan Olal
I have vast tutoring experience of more than 8 years and my primary objective as a tutor is to ensure that a student achieves their academic goals.
78+ Reviews
410+ Question Solved
Related Book For 

Question Posted:
