

According to the Centers for Disease Control, the numbers of new AIDS-related cases for selected years are
Question:
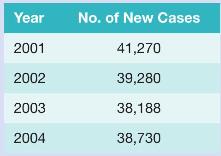
According to the Centers for Disease Control, the numbers of new AIDS-related cases for selected years are shown in Table 15.1.
a. Plot the points represented in Table 15.1 using 2000 as the base year (that is, \(x=0\) represents the year 2000). Plot a point that you think will be the number of new AIDS-related cases in the United States for the year 2006.
b. Use an exponential formula, \(A=A_{0} e^{r t}\) and the data for 2001 and 2004 to find \(r\). Using the plot from part a, graph the equation \(y=41,270 e^{r x}\), and then use this equation to predict the number of new AIDS-related cases in the United States for the year 2006.
c. Using a normal-curve formula with mean at July 1,2002 , and standard deviation \(\sqrt{5}\), we approximate the data with the equation
\[y=\frac{1,500,000 e^{-(x-2.5)^{2} / 10}}{10 \pi}\]
Using the plot from part a, graph this equation and use it to predict the number of new AIDS-related cases in the United States for the year 2006.
d. Using a best-fitting program, we find the equation of a parabola which approximates the given data: \(y=633 x^{2}-4,036 x+44,710\). Using the plot from part a, graph this equation and then use it to predict the number of new AIDS-related cases in the United States for the year 2006.
e. Research the number of AIDS cases in 2008 and decide which model in parts a-d makes the best prediction.
Table 15.1
Step by Step Answer:

This question has not been answered yet.
You can Ask your question!


