

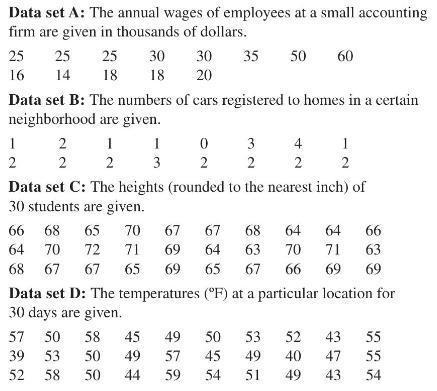
Question: Draw a line graph for each data set in Problems 36-39. Data set (mathrm{C}) Data set A: The annual wages of employees at a small
Draw a line graph for each data set in Problems 36-39.
Data set \(\mathrm{C}\)
Data set A: The annual wages of employees at a small accounting firm are given in thousands of dollars. 25 16 25 25 14 18 1 2 2 2 Data set B: The numbers of cars registered to homes in a certain neighborhood are given. 66 68 65 70 72 64 68 67 67 1 2 30 18 20 57 50 58 39 53 52 58 30 35 1 3 70 71 69 65 0 2 50 60 3 2 Data set C: The heights (rounded to the nearest inch) of 30 students are given. 4 2 1 2 67 67 68 64 64 66 64 63 70 71 63 69 65 67 66 69 69 Data set D: The temperatures (F) at a particular location for 30 days are given. 45 49 52 43 55 50 53 57 45 49 40 47 55 50 49 50 44 59 54 51 49 43 54
Step by Step Solution
3.35 Rating (164 Votes )
There are 3 Steps involved in it
1 Prepare the Axes Draw the Axes On the paper draw two perpendicular lines to create the xaxis horiz... View full answer

Get step-by-step solutions from verified subject matter experts