

Question: Draw a bar graph for each data set in Problems 32-35. Data set (mathrm{D}) Data set A: The annual wages of employees at a small
Draw a bar graph for each data set in Problems 32-35.
Data set \(\mathrm{D}\)
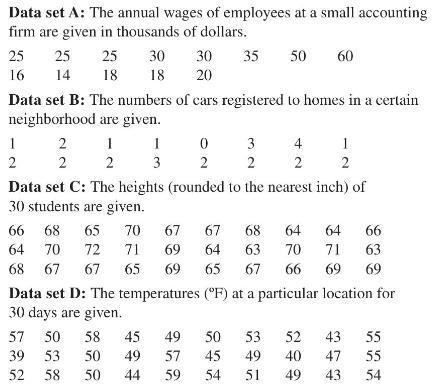
Data set A: The annual wages of employees at a small accounting firm are given in thousands of dollars. 35 25 25 16 14 1 2 25 18 2 2 Data set B: The numbers of cars registered to homes in a certain neighborhood are given. 66 68 65 64 70 72 68 67 67 30 30 18 20 1 2 57 50 58 39 53 52 58 1 3 0 3 2 2 50 60 Data set C: The heights (rounded to the nearest inch) of 30 students are given. 70 67 67 71 69 65 4 2 45 49 50 53 50 49 57 45 49 50 44 59 54 51 1 2 68 64 64 66 64 63 70 71 63 69 65 67 66 69 69 Data set D: The temperatures (F) at a particular location for 30 days are given. 52 43 55 40 47 55 49 43 54
Step by Step Solution
3.42 Rating (152 Votes )
There are 3 Steps involved in it
Data Set A Wage Thousands of dollars Frequency 14 1 16 1 18 2 20 1 25 ... View full answer

Get step-by-step solutions from verified subject matter experts