

Table 18.5 shows the gross national product (GNP) in trillions of dollars for the years 1960-2012. Find
Question:
Table 18.5 shows the gross national product (GNP) in trillions of dollars for the years 1960-2012. Find the average yearly rate of change of the GNP for the requested years in Problems 19-26.
Table 18.5
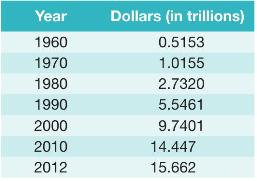
1960 to 2012
Fantastic news! We've Found the answer you've been seeking!
Step by Step Answer:

Answered By
PU Student
cost accounting
financial accounting
auditing
internal control
business analyst
tax
i have 3 years experience in field of management & auditing in different multinational firms. i also have 16 months experience as an accountant in different international firms. secondary school certification.
higher secondary school certification.
bachelors in mathematics.
cost & management accountant
4+ Reviews
10+ Question Solved
Related Book For 

Question Posted:
