

The SAT scores of entering first-year college students are shown in Figure 18.21. In Problems 13-18, find
Question:
The SAT scores of entering first-year college students are shown in Figure 18.21. In Problems 13-18, find the average yearly rate of change of the scores for the requested periods.
Figure 18.21
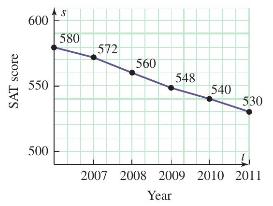
What do you think the rate of change is at \(t=2011\) ?
Fantastic news! We've Found the answer you've been seeking!
Step by Step Answer:

Answered By
Abigael martinez
I have been a tutor for over 3 years and have had the opportunity to work with students of all ages and backgrounds. I have a strong belief that all students have the ability to learn and succeed if given the right tools and support. I am patient and adaptable, and I take the time to get to know each student's individual learning style in order to best support their needs. I am confident in my ability to help students improve their grades and reach their academic goals.
1+ Reviews
10+ Question Solved
Related Book For 

Question Posted:
