

We will discuss scatter diagrams, which are used to study the relationship between two variables, such as
Question:
We will discuss scatter diagrams, which are used to study the relationship between two variables, such as the students' final exam score and final grade in Smith's Math 10 class (see Figure 14.17).
Figure 14.17
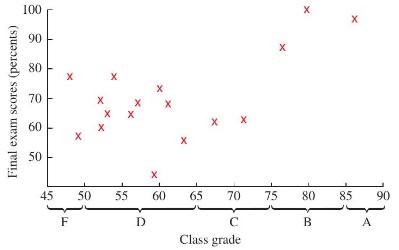
Approximately what is the lowest final exam score received by a student awarded a final grade of \(\mathrm{C}\) or better?
A. \(50 \%\)
B. \(55 \%\)
C. \(60 \%\)
D. \(65 \%\)
Fantastic news! We've Found the answer you've been seeking!
Step by Step Answer:
Based on the scatter diagram the lowest final exam score received by a student awarded a final grade ...View the full answer

Answered By
Utsab mitra
I have the expertise to deliver these subjects to college and higher-level students. The services would involve only solving assignments, homework help, and others.
I have experience in delivering these subjects for the last 6 years on a freelancing basis in different companies around the globe. I am CMA certified and CGMA UK. I have professional experience of 18 years in the industry involved in the manufacturing company and IT implementation experience of over 12 years.
I have delivered this help to students effortlessly, which is essential to give the students a good grade in their studies.
2+ Reviews
10+ Question Solved
Related Book For 

Question Posted:
