

Question: 1. Consider data from Morris & Normand (1992) and earlier analysed by Laird and Louis (1989) relating to 12 studies into chemical carcinogenicity. The effect
1. Consider data from Morris & Normand (1992) and earlier analysed by Laird and Louis
(1989) relating to 12 studies into chemical carcinogenicity.
The effect measure is a slope y expressing tumour response as a function of dose. Laird and Louis (1989) construct posterior intervals for the true slopes θi in order to classify the chemicals as carcinogenetic (θi > 0) or protective (θi contrast fixed and random effects models to demonstrate that inferences on the overall effect μ may be affected. Letting Wi = 1/s2 i , a simple chi square test using the criterion iWi (yi − ¯y)2 (with 11 degrees of freedom) suggests substantial heterogeneity. Obtain μ under a fixed effects model with prior μ ∼ N(0, 1000) and under a random effects model, again with μ ∼ N(0, 1000), but with second stage random standard deviation, τ ∼ U(0, 10). Note that if the analysis is undertaken in the WINBUGS package then the normal density for θi involves the precision 1/τ 2. Are there any changes in the ranking of the chemicals after the random effects analysis as compared with the raw data rankings.
What are the posterior carcinogenicity probabilities Pr(θi > 0|y)? Is any difference made if a uniform prior on B = τ 2/(τ 2 + s2 0 ) is used instead of the uniform prior on τ ?
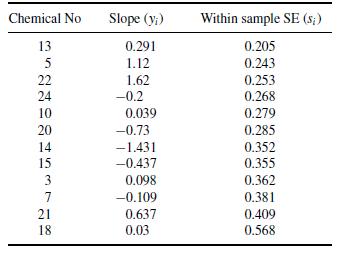
Chemical No Slope (yi) Within sample SE (s;) BRENNAERTER 13 0.291 0.205 5 1.12 0.243 22 1.62 0.253 24 -0.2 0.268 10 0.039 0.279 20 -0.73 0.285 14 -1.431 0.352 15 -0.437 0.355 3 0.098 0.362 7 -0.109 0.381 21 0.637 0.409 18 0.03 0.568
Step by Step Solution
There are 3 Steps involved in it

Get step-by-step solutions from verified subject matter experts