

Question: chip Failures. The histogram in Figure 10 shows the time until failure for a sample of 108 computer chips. Over the histogram, draw a smooth
chip Failures. The histogram in Figure 10 shows the time until failure for a sample of 108 computer chips. Over the histogram, draw a smooth curve that captures its general features. Then classify the distribution according to its number of modes and its symmetry or skewness. In words, summarize the meaning of your results.
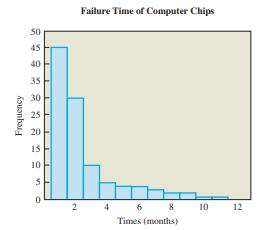
Frequency 50 45 40 35 30 25 20 15 10 S 0 2 Failure Time of Computer Chips 6 Times (months) 8 10 12
Step by Step Solution
There are 3 Steps involved in it
1 Expert Approved Answer
Step: 1 Unlock

Question Has Been Solved by an Expert!
Get step-by-step solutions from verified subject matter experts
Step: 2 Unlock
Step: 3 Unlock