

Question: Constant Dollars. The graph in Figure 41 shows the minimum wage in the United States, together with its purchasing power, which is adjusted for inflation
Constant Dollars. The graph in Figure 41 shows the minimum wage in the United States, together with its purchasing power, which is adjusted for inflation with 1996 used as the reference year. The graph represents the years from 1955 to 2011. Summarize what the graph shows.
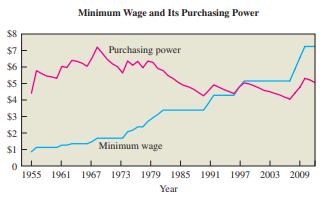
$7 $6 2 5 3 2 3 $1 Minimum Wage and Its Purchasing Power Purchasing power Minimum wage 1955 1961 1967 1973 1979 1985 1991 1997 2003 2009 Year
Step by Step Solution
There are 3 Steps involved in it
1 Expert Approved Answer
Step: 1 Unlock

Question Has Been Solved by an Expert!
Get step-by-step solutions from verified subject matter experts
Step: 2 Unlock
Step: 3 Unlock